Monitor and Debug
Use the Web UI and CLI to monitor pipeline health, view logs, and diagnose failures.
Check workspace status
Get a quick overview from the CLI:
dlt runtime info
This shows your workspace name, job count, latest run status, and latest deployment/configuration versions. See dlt runtime info.
View logs
From the CLI
Show logs for the latest run of a job:
dlt runtime logs my_pipeline.py
Show logs for a specific run number:
dlt runtime logs my_pipeline.py 3
Add --follow (or use it with dlt runtime launch) to stream logs in real time while a run is in progress.
See dlt runtime logs and dlt runtime job-run logs for all options.
From the Web UI
Click any run in the Jobs runs table to open the run detail page:
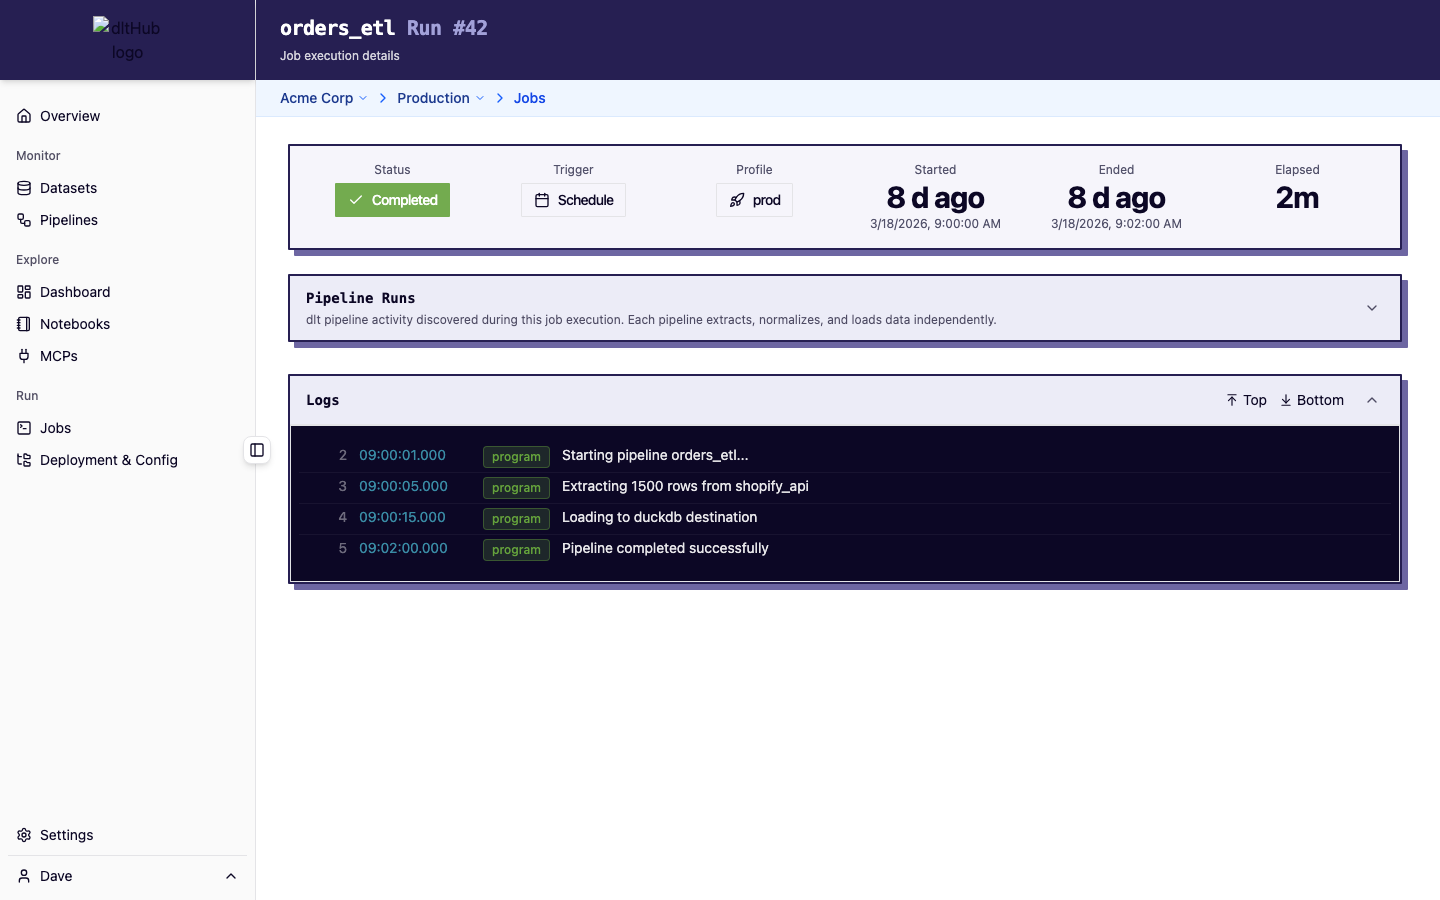
This shows:
- Status bar -- status badge, trigger type, profile, start/end timestamps, and elapsed time (live-updating if running)
- Pipeline runs table -- all dlt pipeline runs that occurred during this job, with row counts and status
- Log viewer -- real-time streaming logs (refreshes every second while running) or static logs for completed runs
Understand run states
| Status | Meaning |
|---|---|
| Pending | Run is queued, waiting to start |
| Starting | Run is being initialized |
| Running | Actively executing |
| Completed | Finished without errors |
| Failed | Encountered an error -- check logs for details |
| Cancelled | Manually stopped via CLI or Web UI |
Diagnose a failed run
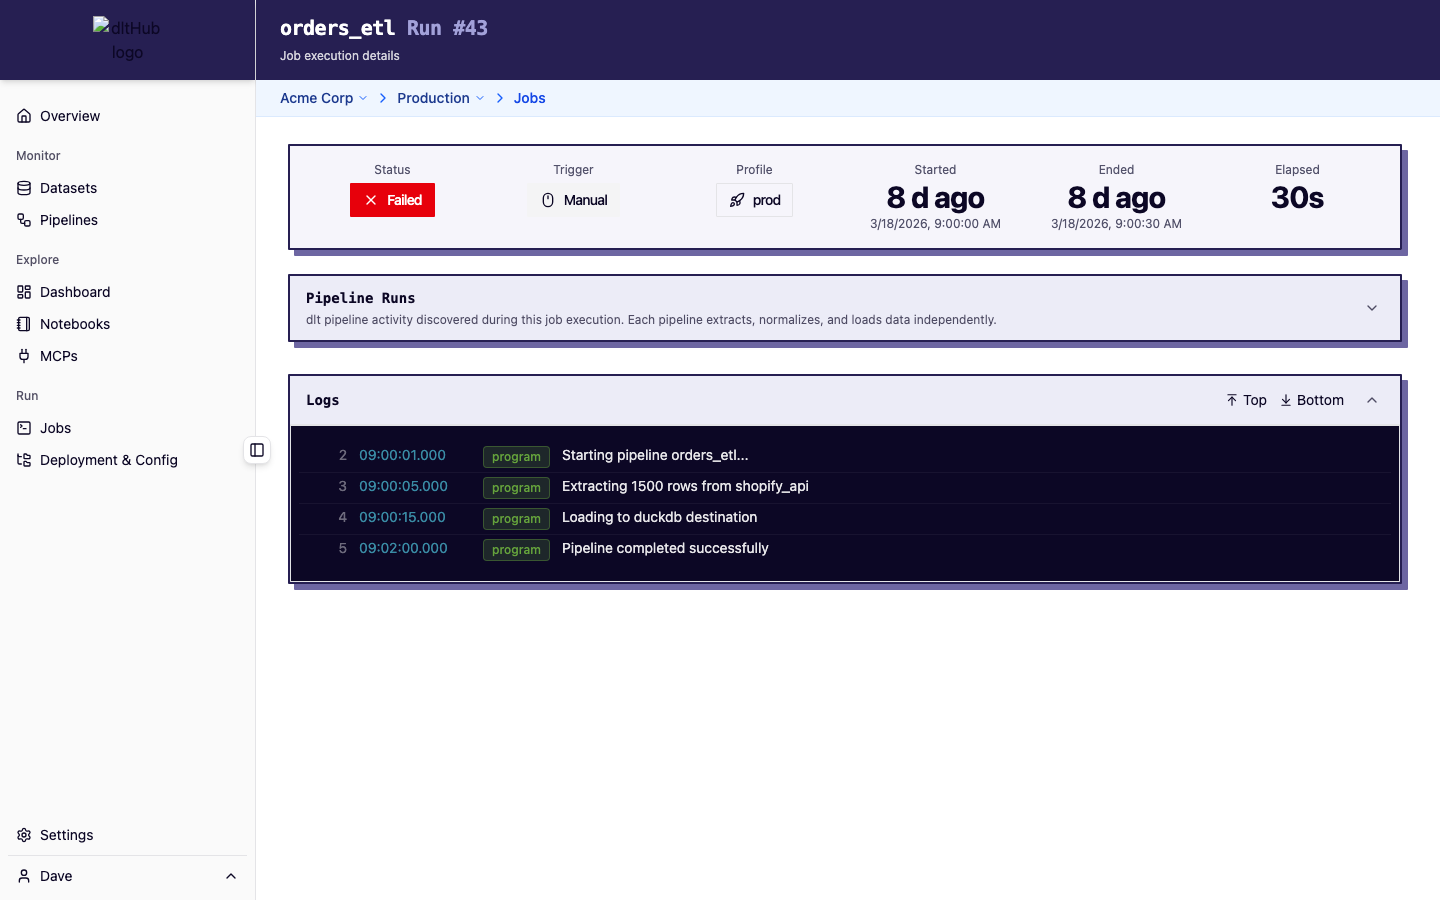
- Check logs -- the log viewer on the run detail page shows the full execution output, including stack traces for errors
- Check pipeline runs -- the pipeline runs table on the run detail page shows which dlt pipelines ran and whether they succeeded. Click a pipeline run for detailed load info (tables loaded, row counts, bytes, duration)
- Check the dashboard -- the Dashboard and Pipelines pages show success rate trends that help identify recurring issues
- Check your deployment -- the Deployment & Config page shows which code version is deployed. Make sure your latest changes are synced with
dlt runtime deploy
Cancel a stuck run
dlt runtime cancel my_pipeline.py
Or cancel a specific run number:
dlt runtime cancel my_pipeline.py 5
See dlt runtime cancel. You can also cancel from the run detail page or the Jobs page context menu.
Monitor pipeline metrics
The Pipelines page provides aggregated telemetry:
- Success rate -- percentage of successful runs over time
- Rows loaded -- total data volume trends
- Duration -- performance trends to spot regressions
- Charts -- time-series visualization with toggleable views (Runs, Rows, Bytes, Duration)
The Dashboard provides a workspace-wide overview of all pipeline activity.
Known limitations
- Batch jobs have a configurable maximum runtime. Jobs exceeding this limit are automatically cancelled. Check your deployment's configuration for the exact value.
- For more details, see the Runtime limitations in the dlt docs.