Pipelines and Datasets
The Pipelines and Datasets pages show telemetry data collected from your dlt pipeline runs -- load metrics, success rates, row counts, and performance trends.
Pipelines page
A job is a script you deploy and run. A pipeline is a dlt pipeline object created inside that script (e.g., dlt.pipeline("my_pipeline")). One job can create multiple pipelines. The Jobs page manages execution; this page shows what the pipelines loaded.
Hero stats
Aggregated metrics across all pipelines for the selected time range: total runs, success rate, rows loaded, bytes loaded, average duration, and latest status.
Telemetry chart
Time-series visualization of pipeline activity. Toggle between views:
- All -- combined overview
- Runs -- execution count over time
- Rows -- rows loaded over time
- Bytes -- data volume over time
- Duration -- average run duration over time
Pipelines table
| Column | Description |
|---|---|
| Pipeline | Pipeline name |
| Sources | Data sources used |
| Destination | Target data warehouse/lake |
| Status | Latest run status |
| Runs | Total run count |
| Success Rate | Percentage of successful runs |
| Rows Loaded | Total rows loaded |
| Bytes Loaded | Total data volume |
| Avg Duration | Average run time |
| Last Run | Most recent execution |
Click a pipeline row to open the pipeline detail page, which shows the same stats, chart, and a filtered pipeline runs table for that specific pipeline.
Pipeline runs table
Below the pipelines table, a list of recent pipeline run executions across all pipelines. Click a row to see the pipeline run detail page:
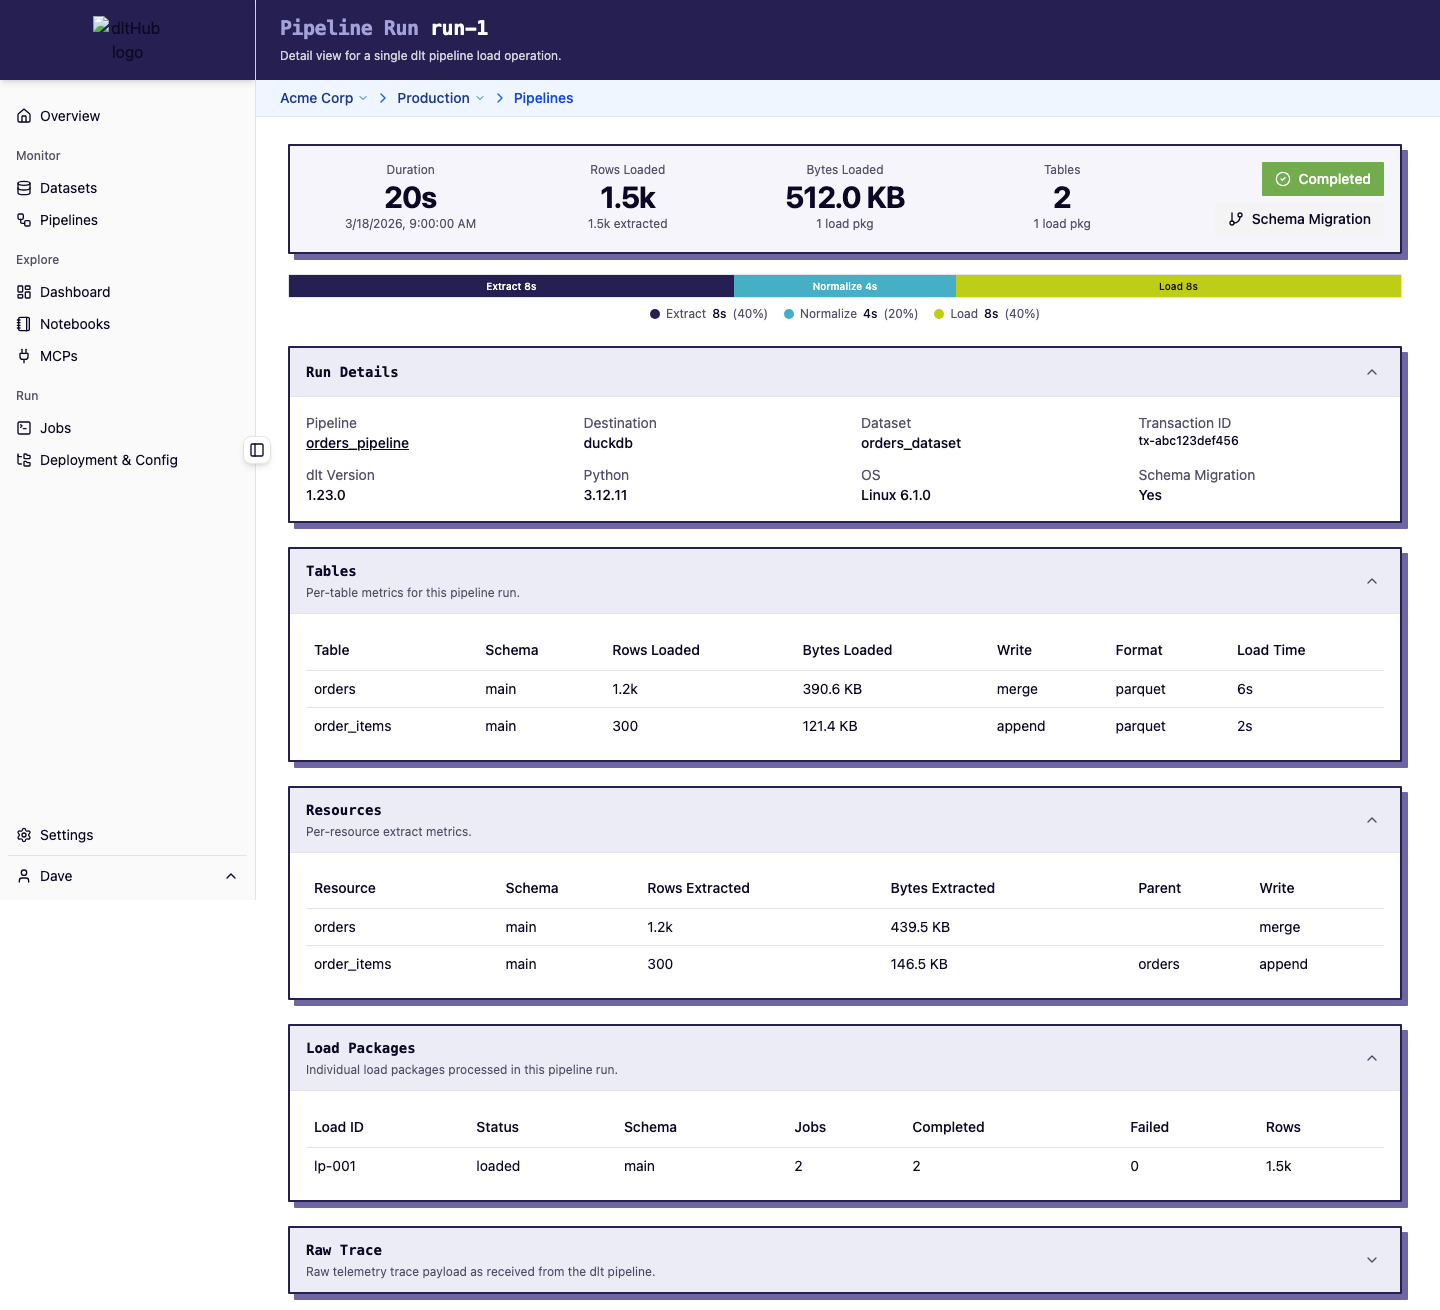
This page shows:
- Rows extracted and loaded
- Bytes loaded and duration
- Tables loaded with schema, row counts, write disposition, and format
- Load package details and timing
- dlt version and environment info
Datasets page
Datasets represent the target schemas where pipelines load data.
Datasets table
| Column | Description |
|---|---|
| Dataset | Dataset/schema name |
| Destination | Target warehouse |
| Pipeline | Associated pipeline(s) |
| Runs | Total pipeline runs into this dataset |
| Success Rate | Percentage of successful loads |
| Rows Loaded | Total rows loaded |
| Bytes Loaded | Total data volume |
| Last Run | Most recent load |
Click a dataset row to open the dataset detail page with focused stats, chart, and pipeline runs filtered for that dataset.
Time range
Both pages share a time range selector in the header (default: last 7 days) that controls all stats, charts, and tables.